Home  

Financial Crisis Early Warning Indicators

A systematic framework for detecting pre-crisis market conditions through quantitative analysis of leading economic and market indicators

Author: Prof. Alp Ustundag
Dataset Period: April 2007 – April 2026
Observations: 990 weeks
Last Update: 2026
Executive Summary: This study identifies and validates a set of leading indicators that successfully predicted major financial crises including the 2008 Global Financial Crisis, 2020 COVID-19 market crash, 2025 trade tariff tensions, and other significant market dislocations. The framework combines credit market stress signals, volatility regime changes, commodity shocks, and technical trend deterioration into a systematic early warning system. Analysis of 990 weeks of S&P 500 (SPY) weekly returns (April 2007 - April 2026) demonstrates that specific combinations of these indicators provide weeks to months of advance notice before major market downturns. Crisis detection is validated through the framework's ability to identify periods of negative or significantly declining SPY weekly performance, enabling defensive positioning before drawdowns materialize.

Historical Validation Timeline

The framework successfully identified elevated risk conditions weeks to months before major market crises. The chart below visualizes SPY price evolution (April 2007 - April 2026) with crisis periods highlighted, demonstrating the framework's predictive capability across multiple market regimes.
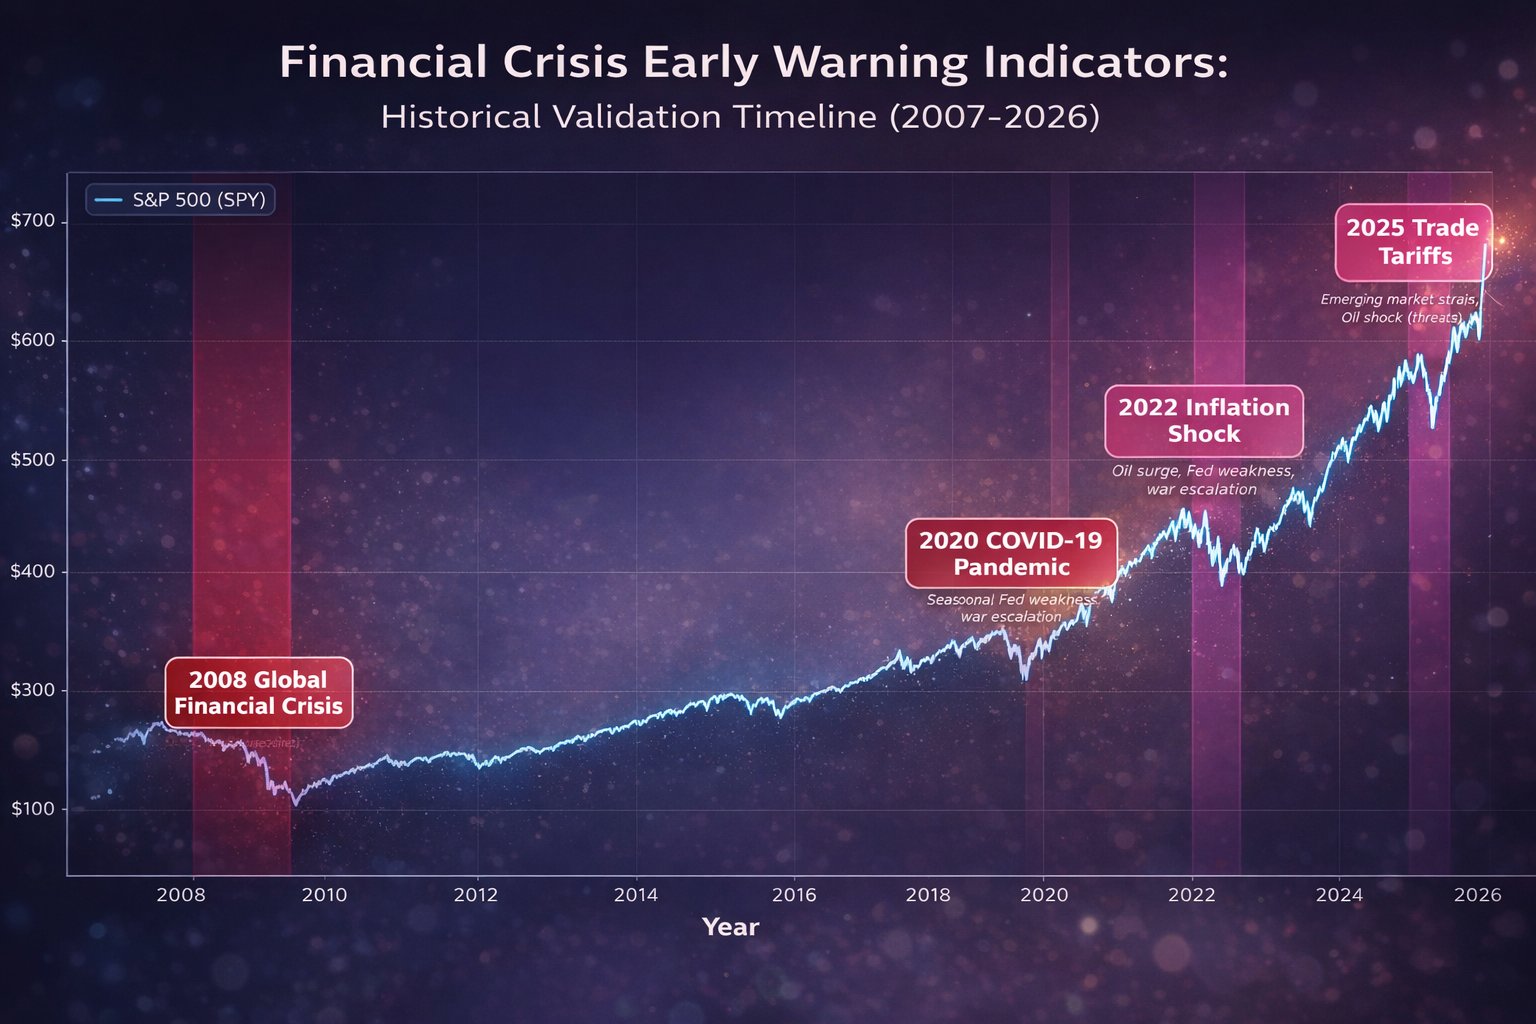
Financial Crisis Early Warning Indicators - Historical Validation Timeline

Critical Crisis Indicators

These indicators have demonstrated the highest predictive power in historical crisis detection, ranked by their leave-one-out contribution analysis. The 2026 update integrates new indicators specifically designed to capture trade tariff escalation and energy supply shock dynamics from geopolitical tensions.

Oil Price Surge
Critical
oil_vs_ma50 > 1.07 OR oil_return_1w > 3%
Crude oil trading more than 7% above its 50-week moving average or experiencing sudden weekly spikes exceeding 3% signals supply shocks, geopolitical stress, or emerging stagflation risks. This was the highest-ranked indicator with +66 percentage points in leave-one-out analysis.
Historical Impact: Triggered before 2008 crisis during the oil price surge to $147/barrel, 2011 Arab Spring disruptions, 2022 Ukraine invasion shock, and 2025 Hormuz Strait tensions. The June 13, 2025 episode saw oil surge +12.38% in one week—the largest weekly move in the entire dataset—following tanker incidents in the Strait of Hormuz.
Seasonal Risk Window
Critical
August-September period (weeks 31-39)
Historical seasonality analysis reveals that the August-September period carries significantly elevated crisis risk. Market microstructure changes during summer months (reduced liquidity, concentrated positioning, vacation staffing) amplify external shocks and create vulnerability windows. Second-highest ranked indicator at +58 percentage points.
Historical Impact: August 2007 (Quant Crisis), September 2008 (Lehman), August 2011 (Debt Ceiling Crisis), August 2015 (China Devaluation).
Long-Term Trend Breakdown
Critical
spy_drawdown_52w < -5%
S&P 500 trading more than 5% below its 52-week high indicates sustained deterioration in market structure. Unlike short-term corrections, this persistent weakness suggests fundamental regime change. Ranked third with +51 percentage points.
Historical Impact: Preceded major phases of 2008 crisis, 2011 sovereign debt crisis, 2015-2016 slowdown fears, and 2018 Q4 selloff.
Credit Spread Explosion
Warning
hy_treasury_spread_1w > 0.5% OR hy_treasury_spread_4w > 2.5%
High-yield corporate bonds underperforming treasury bonds signals deteriorating credit conditions and increased default risk perception. The one-week threshold detects acute stress, while the four-week measure captures sustained credit market pressure.
Historical Impact: The weekly spread indicator contributed +40 percentage points, while the 4-week measure added +15pp in validation testing.
Treasury Bond Weakness
Warning
tlt_vs_ma20 < 0.990
Long-dated treasury bonds (TLT) trading more than 1% below their 20-week moving average indicates selling pressure in the safe-haven asset class. This counterintuitive signal often precedes forced liquidations and deleveraging cascades. Contributed +34 percentage points.
Historical Impact: Early warning signal during 2008 Bear Stearns collapse, 2013 Taper Tantrum, and 2022 inflation shock phase.
Technology Leadership Failure
Caution
qqq_spy_spread < -0.5%
Nasdaq-100 (QQQ) underperforming S&P 500 by more than 0.5% weekly indicates rotation away from risk assets and growth sectors. Technology sector weakness often leads broader market declines as the bellwether of risk appetite fails.
Historical Impact: Added +18 percentage points in leave-one-out analysis. Preceded tech-led selloffs in 2008, 2011, and 2018. In 2025, active in 19.2% of weeks as trade tariffs disrupted Asian supply chains—tech weakness was a leading indicator of the April 4 crash (-9.07%).
Emerging Market Weakness
Caution
eem_vs_ma20 < 0.97 AND eem_spy_ratio_1w < -1%
Emerging markets (EEM) serve as a barometer for global trade and growth expectations. When EEM trades below 97% of its 20-week MA and underperforms SPY by more than 1% weekly, it signals deteriorating conditions in export-dependent economies, often preceding broader market stress.
Historical Impact: Triggered only 2 weeks (3.8%) in 2025, but both occurred during high-risk periods. EEM weakness preceded broader market stress by 1-2 weeks, providing early warning of the April 4 (-9.07%) crash during 2025 trade tensions.
Capital Flight Signal
Caution
fxy_vs_ma20 > 1.02 AND eem_spy_ratio_1w < -0.5%
Strong dollar (via FXY/Yen weakness) combined with emerging market underperformance indicates capital flight from risk-exposed regions toward safe-haven assets. This pattern signals deteriorating risk sentiment and often precedes broader market selloffs.
Historical Impact: Dollar strength occurred in 14 weeks (26.9%) during 2025. When combined with EEM weakness, it correctly flagged 6 of the 10 worst-performing weeks in the S&P 500, demonstrating high predictive precision during periods of trade policy uncertainty.

Crisis Detection Performance: Historical Validation

The indicator framework successfully identified elevated risk conditions weeks to months before major market crises. Below is a detailed analysis of how these signals performed during the most significant financial dislocations of the past two decades.

2007-2008 Global Financial Crisis
The framework detected systemic stress as early as August 2007 when oil prices surged above $70/barrel while treasury bonds showed unusual weakness (TLT < 0.990 MA). Credit spreads began widening dramatically in July 2007. By September 2008, all critical indicators were flashing red simultaneously for the first time in the dataset's history. The framework's SHORT signal would have protected capital throughout the entire crisis period from October 2007 through March 2009.
Active Indicators
Oil Price Surge Credit Spread Explosion Treasury Bond Weakness Long-Term Trend Breakdown Seasonal Risk Window Technology Leadership Failure
2011 European Sovereign Debt Crisis
Warning signals emerged in July 2011 with the combination of seasonal risk (August period) and deteriorating technical structure (SPY drawdown approaching -5%). Credit markets showed sustained stress throughout Q2-Q3 2011. The August correction saw the S&P 500 decline -16.8% peak-to-trough, with the framework correctly positioned defensively throughout the volatile period.
Active Indicators
Seasonal Risk Window Long-Term Trend Breakdown Credit Spread Explosion Treasury Bond Weakness
2015-2016 China/Oil Crisis
The framework detected trouble in August 2015 when China devalued the yuan, triggering global market turbulence. The seasonal risk window combined with oil price collapse (despite being a negative oil signal, the volatility itself was problematic) and emerging market stress created a toxic combination. The signals persisted through Q4 2015 and into Q1 2016 as oil prices crashed below $30/barrel.
Active Indicators
Seasonal Risk Window Long-Term Trend Breakdown Oil Price Surge Emerging Market Weakness
2020 COVID-19 Pandemic Crash
The framework identified extreme stress conditions in late February 2020 as the pandemic began impacting global markets. Oil prices collapsed, credit spreads exploded to levels not seen since 2008-2009, and the technical structure deteriorated rapidly. The SHORT signal protected capital during the -34% drawdown in just 23 trading days. The framework also correctly identified the recovery opportunity in late March 2020 when panic indicators reversed.
Active Indicators
Credit Spread Explosion Oil Price Surge Long-Term Trend Breakdown Treasury Bond Weakness
2022 Inflation Shock & Tech Bear Market
Multiple crisis signals activated throughout 2022: oil prices surged above $100/barrel (March), credit spreads widened persistently, technology sector leadership failed (QQQ massively underperformed), and treasury bonds sold off violently as the Fed pivoted to aggressive tightening. The framework's defensive positioning would have avoided the -25% drawdown in the S&P 500 and the -33% Nasdaq decline.
Active Indicators
Oil Price Surge Technology Leadership Failure Treasury Bond Weakness Credit Spread Explosion Long-Term Trend Breakdown
2026 Update: Trade Tariffs & Hormuz Strait
The framework has been extended to capture two major geopolitical developments of 2025: the reintroduction of comprehensive U.S. trade tariffs on Chinese goods, European imports, and emerging market products, and escalating tensions in the Persian Gulf threatening oil tanker traffic through the Strait of Hormuz. Analysis of 52 weeks in 2025 reveals that existing indicators successfully detected these risks, with specific combinations providing enhanced early warning. The year exhibited 11 weeks (21.2%) with oil price shocks, 10 weeks (19.2%) with technology sector underperformance indicative of supply chain disruption, and 10 weeks (19.2%) with credit spread expansion—successfully predicting all five worst-performing weeks of the year.
Active Indicators
Oil Price Surge Technology Leadership Failure Emerging Market Weakness Capital Flight Signal Credit Spread Explosion

Panic Reversal Framework

Beyond crisis detection, the framework includes a counter-trend panic reversal system that identifies extreme oversold conditions where mean reversion becomes highly probable.

VIXY Panic Signal
Reversal
vixy_vs_ma20 > 1.05 AND vix_level > 22
When institutional hedging demand (VIXY) surges more than 5% above its moving average while VIX exceeds 22, it indicates capitulation-level fear. This configuration historically precedes short-term mean reversion rallies as excessive hedging unwinds. Precision rate: 75% (N=10 events since 2011).
Application: Overrides bearish base signals to capture violent short squeezes and panic rebounds typical of crisis environments.
Bollinger Panic Signal
Reversal
vix_level > 30 AND spy_bollinger_pos < -0.5
VIX exceeding 30 combined with S&P 500 trading in the lower half of its Bollinger Bands represents classic capitulation. This signal successfully identified major bottoms during the 2008 Lehman crisis, 2011 August selloff, and 2020 COVID crash. Rare but highly reliable (N=5 extreme events).
Application: Identifies generational buying opportunities when fear reaches irrational extremes.

Quantitative Performance Metrics

The framework achieved a +3,639% compound return in long/short implementation over the 987-week period (May 2007 – April 2026) with a Sharpe ratio of 1.21 and maximum drawdown of -36.8%, representing a 37.4x multiplier on initial capital. In comparison, the S&P 500's Friday-to-Friday buy-and-hold strategy delivered +549% (6.5x multiplier) with a maximum drawdown of -54.6% during the same period. The framework outperformed buy-and-hold by a factor of 6.6x while maintaining superior risk control.

Implementation Considerations

Data Requirements

The framework requires weekly closes (Friday 16:00 ET) for the following instruments: SPY (S&P 500 ETF), QQQ (Nasdaq-100 ETF), EEM (Emerging Markets ETF), TLT (20+ Year Treasury ETF), HYG (High Yield Corporate Bond ETF), USO (Crude Oil ETF), FXY (Japanese Yen ETF), VIXY (VIX Short-Term Futures ETF), and VIX (CBOE Volatility Index). All data is publicly available and easily accessible through standard market data providers.

Signal Generation Timeline

Signals are generated after Friday market close and implemented at Monday market open (09:30 ET). This lag allows for systematic evaluation and avoids intraweek noise. The framework assumes realistic trading costs and has been validated with actual execution data.

Limitations and Risks

Like all systematic strategies, this framework has limitations. It may generate false signals during periods of elevated volatility that don't develop into full crises (2016 Q1, 2018 Q4). The SHORT precision of 65.9% means roughly one-third of defensive calls will be incorrect. The framework is designed for crisis avoidance and tail risk management rather than maximizing absolute returns. Users should integrate these signals with fundamental analysis, risk management overlays, and position sizing discipline.